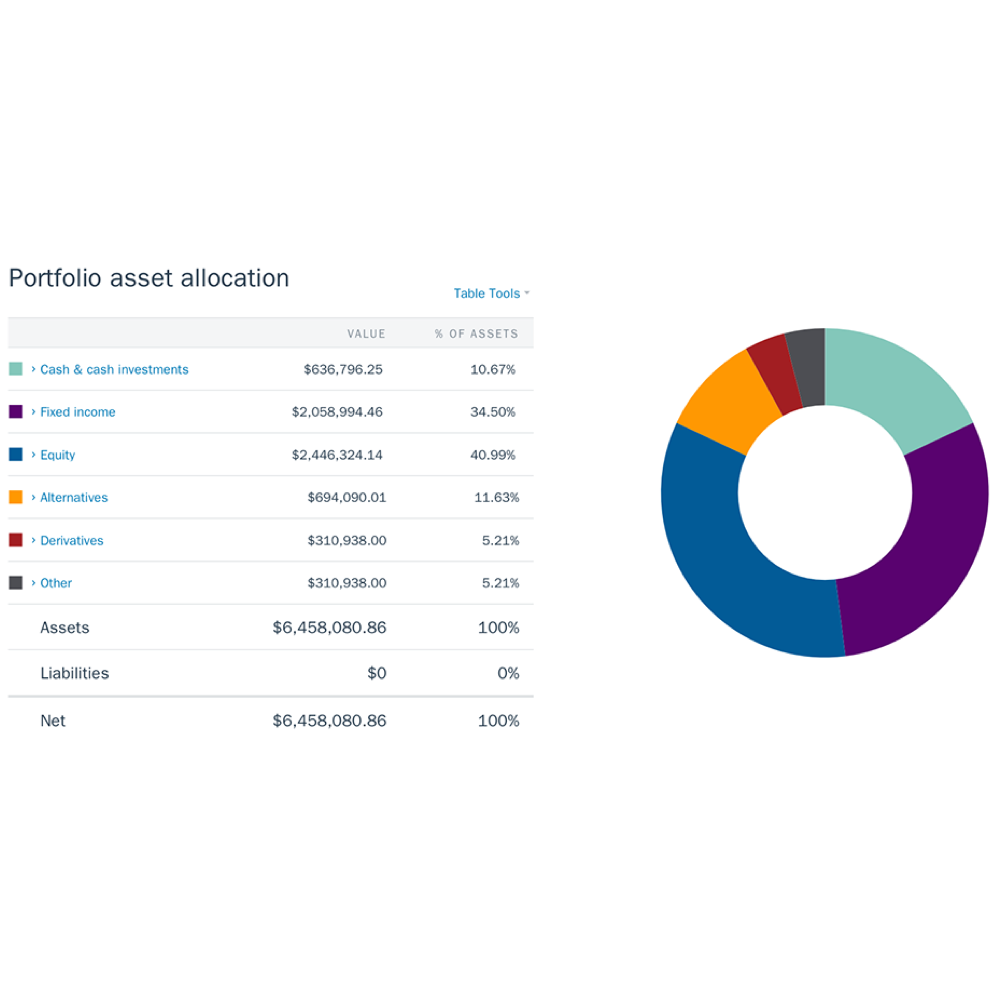
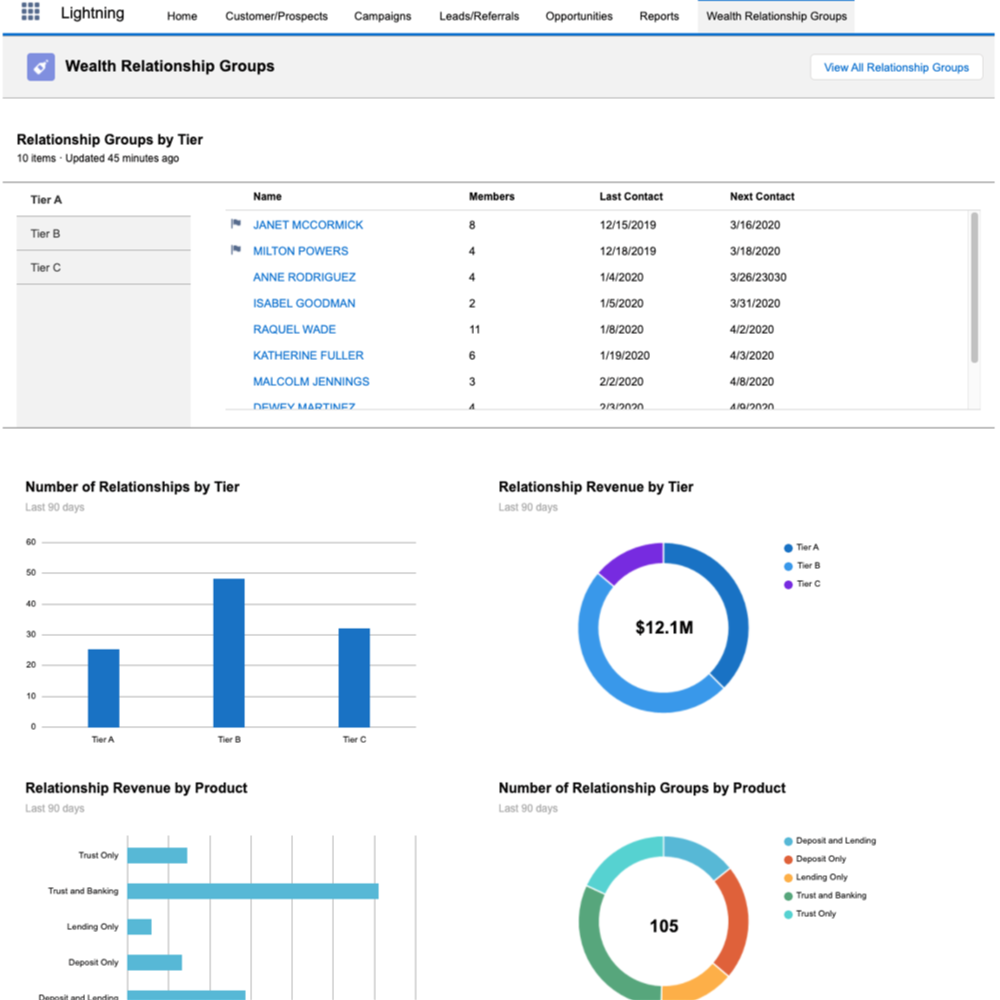
Interpreting data benefits from visualizations that help show the relationships between data points, trends, and overall breakdown of information. These examples show customer-facing and advisor-facing views for financial services.
/ senior UX pro / writer / team manager / process thinker
Interpreting data benefits from visualizations that help show the relationships between data points, trends, and overall breakdown of information. These examples show customer-facing and advisor-facing views for financial services.